| ... | ... | @@ -5,4 +5,4 @@ OPAL writes two kind of data: |
|
|
|
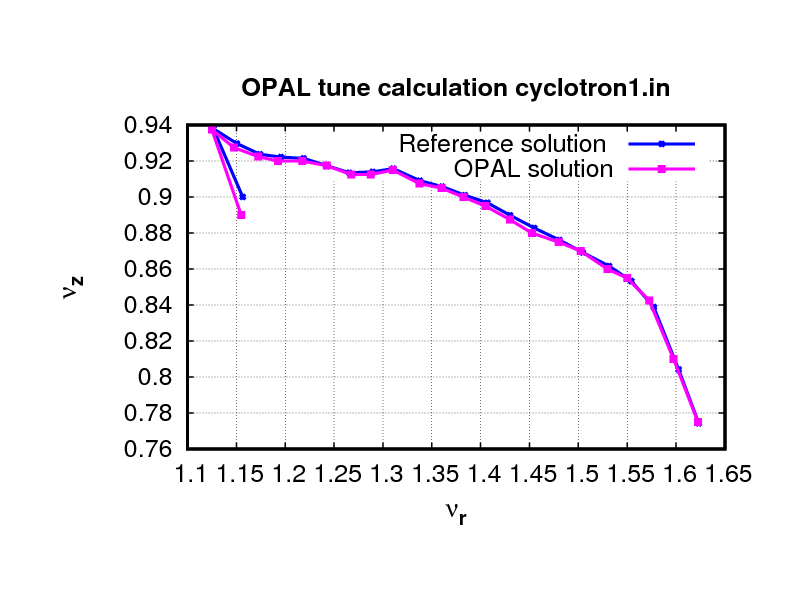
The statistical data can be conveniently plotted with [gnuplot](http://www.gnuplotting.org), as shown in the example section [Cyclotron](Cyclotron). For the
|
|
|
|
h5 data we provide a [root](https://root.cern.ch/) based plotting utility [H5root](http://amas.web.psi.ch/tools/H5root/index.html).
|
|
|
|
|
|
|
|
<center>[](/OPAL/wiki/TracIni#ctclotron1)</center> |
|
|
|
<center>[](/OPAL/wiki/TracIni#ctclotron1)</center> |