How to run the Jungfrau detector
Start the JF detector and control tool
- Switch on detector by pressing the toggle switch on detector --> green light should start blinking.
Note: If there JF does not switch on it may be because the flow in the chiller is not enough due to filter clogging. Check the display in the chiller. The minimum value is 4 l/min. If it is below that value, exchange the filter.
-
Open run control from terminal: /sf/jungfrau/bin/run_control
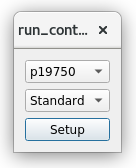
2.1 Choose pgroup
2.2 Press setup
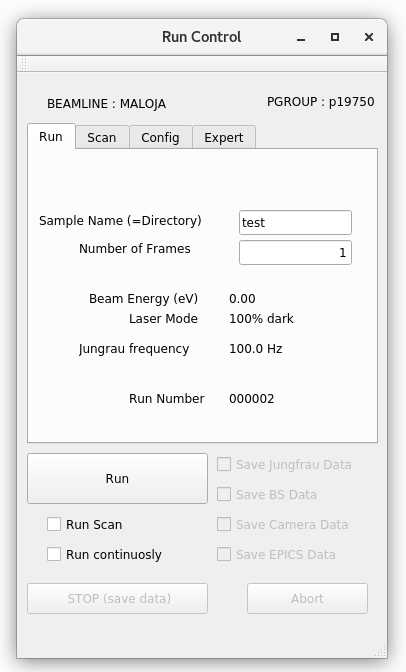
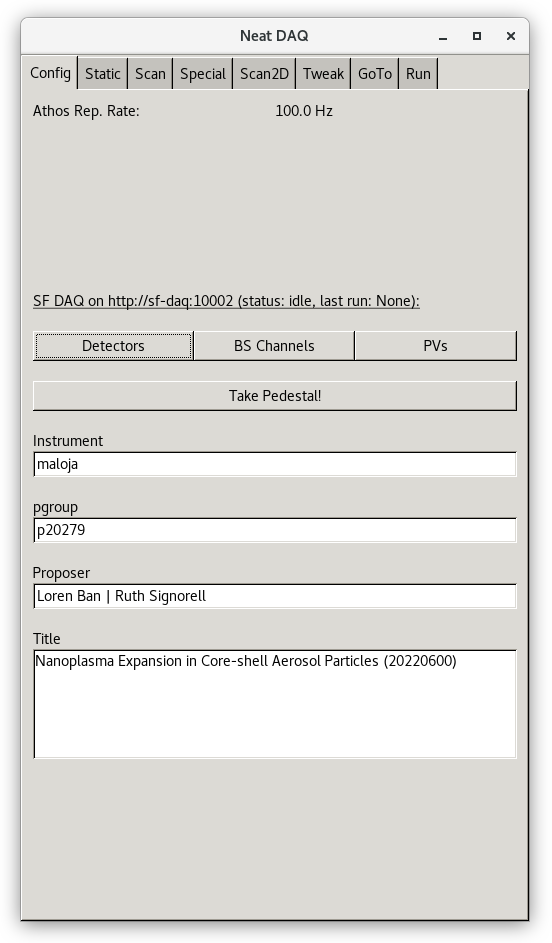
The following window appears:
Note that only 2 windows can be open simultaneously.
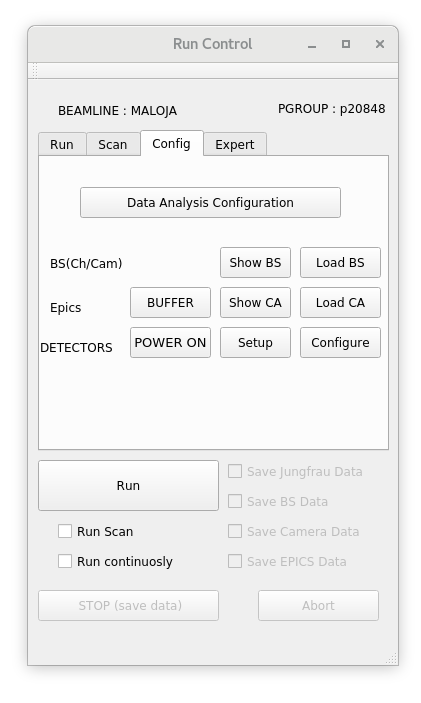
- Go to config window:
3.1 Press power on
The following window appears:
Click on power on.
3.2 Wait for 2-3 minutes
- If everything worked, the previous window should dissapear, then go to: http://sf-daq-maloja:5015/ This should open the control window and click on connect (blue button):
The button should change to green color and say receiving. If it says polling and remains in orange it is not connecting.
A possible reason is that the transceivers are not well plugged in the switch (in the rak) or that any of the optical fibers are not clean. If that is the case, when trying to run a scan we would get an error like: "Error, reason: everything fine but no request to write any data". Which means that the data of any of the modules or the pulse IDs are not being properly received.
- In run control, go to "Config" and press "Configure".
In the pop-up window: click JF.... detector.
- To take a new pedestal (background):
Option a) Go to "Expert" panel, click "Take Pedestal" then Run.
Option b) Take it directly in slic:
Note: If we do not have the detector selected we would get the following error: "Error(pedestal procedure), reason : no detectors defined"
Live analysis panel (SPI)
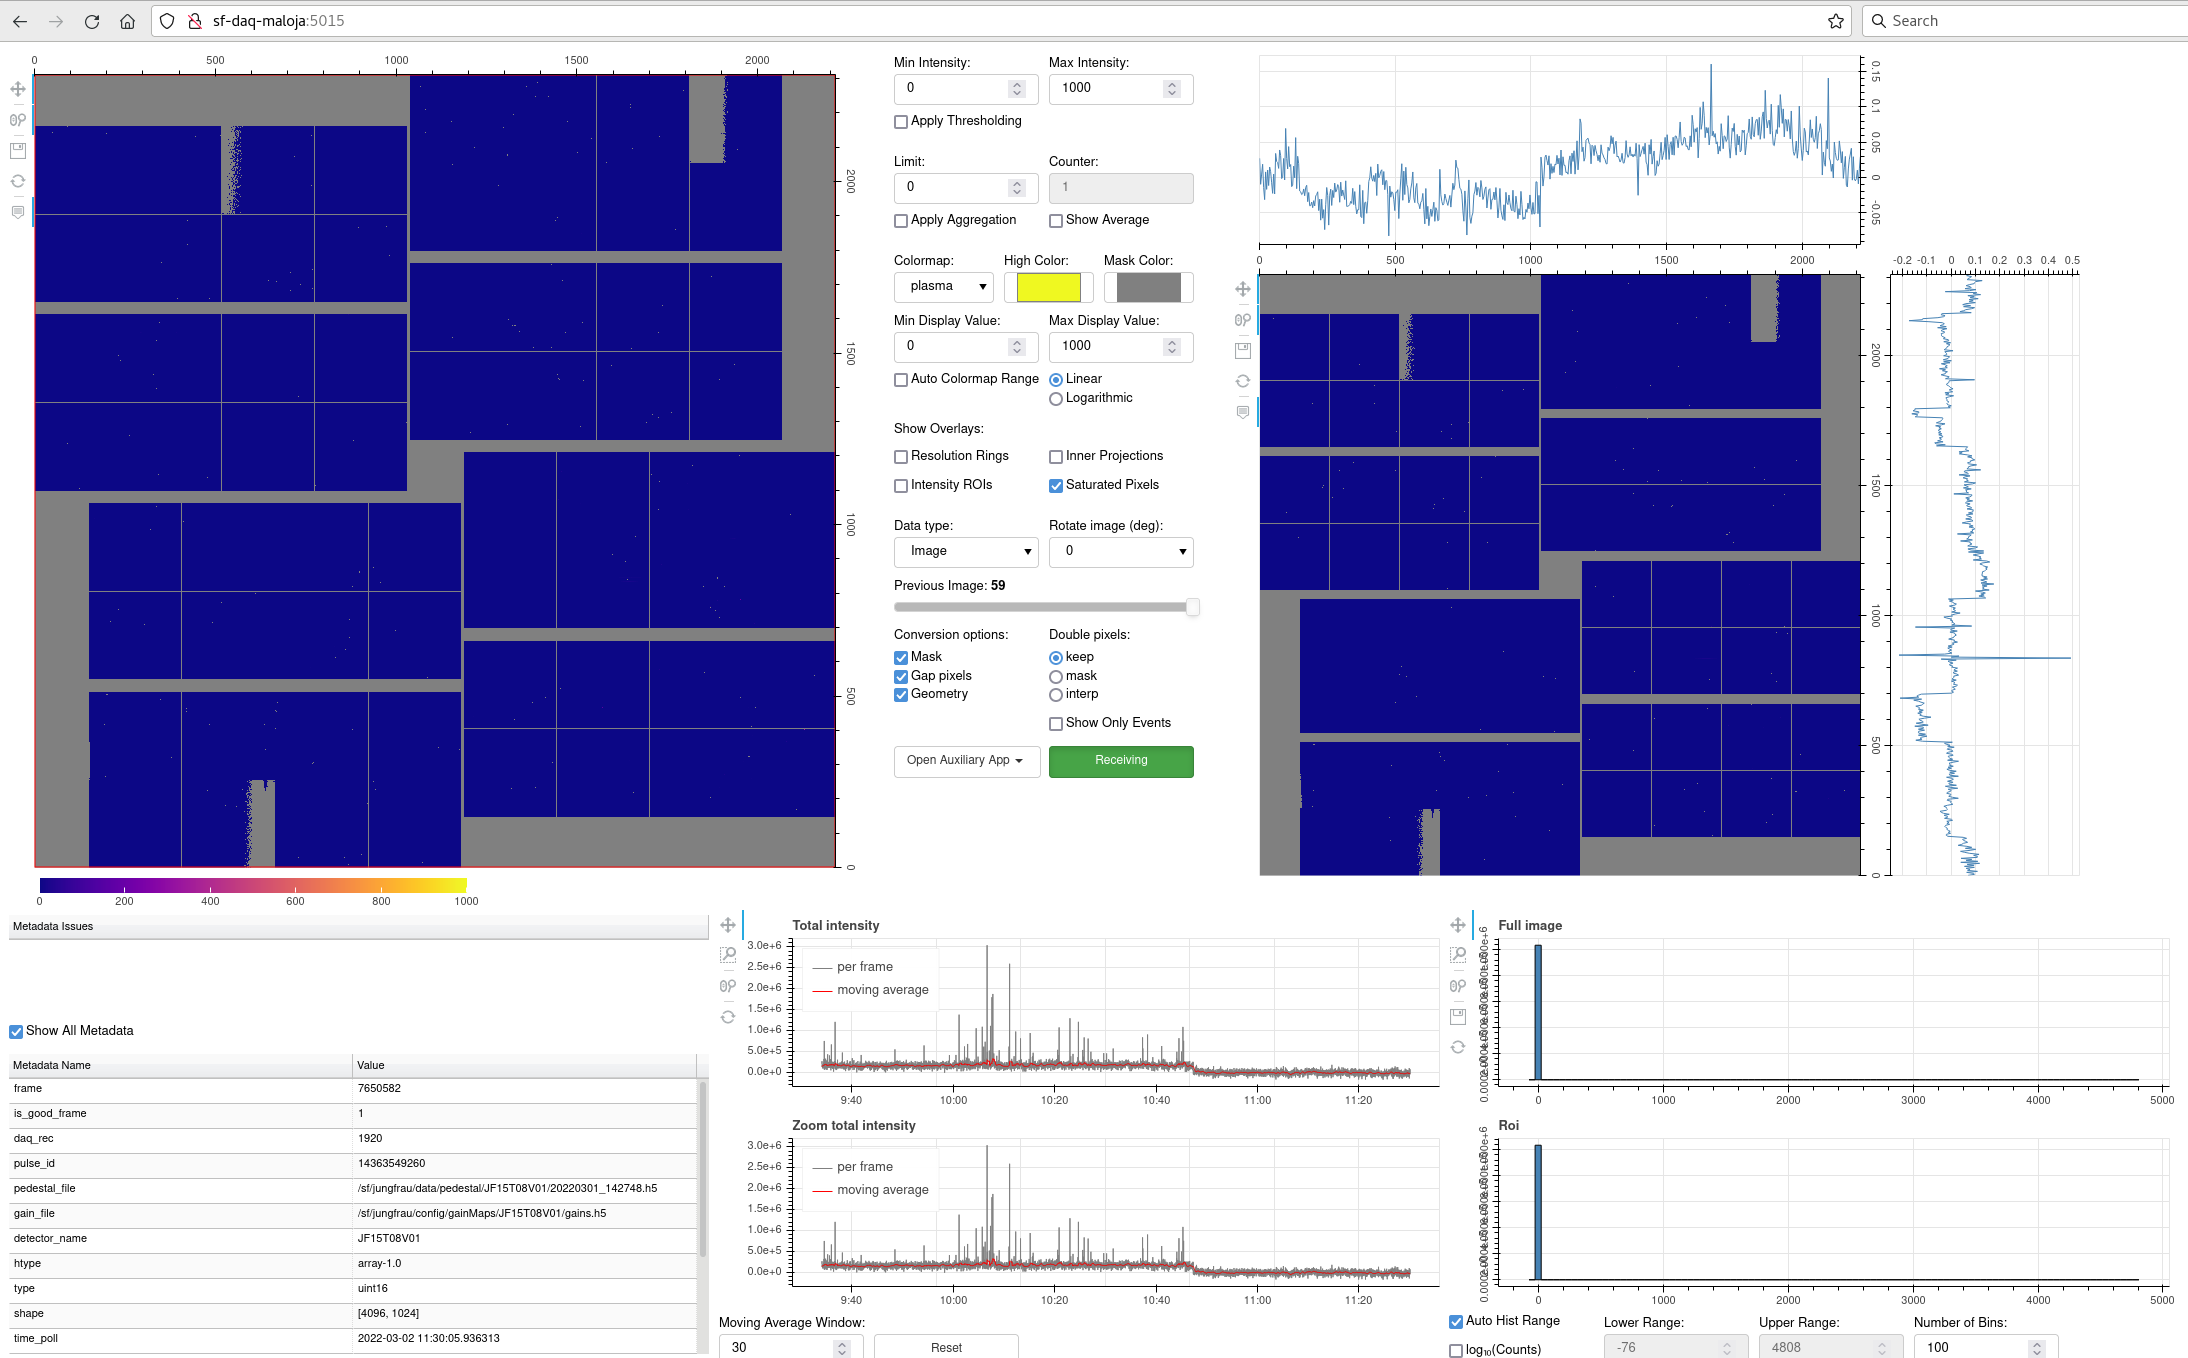
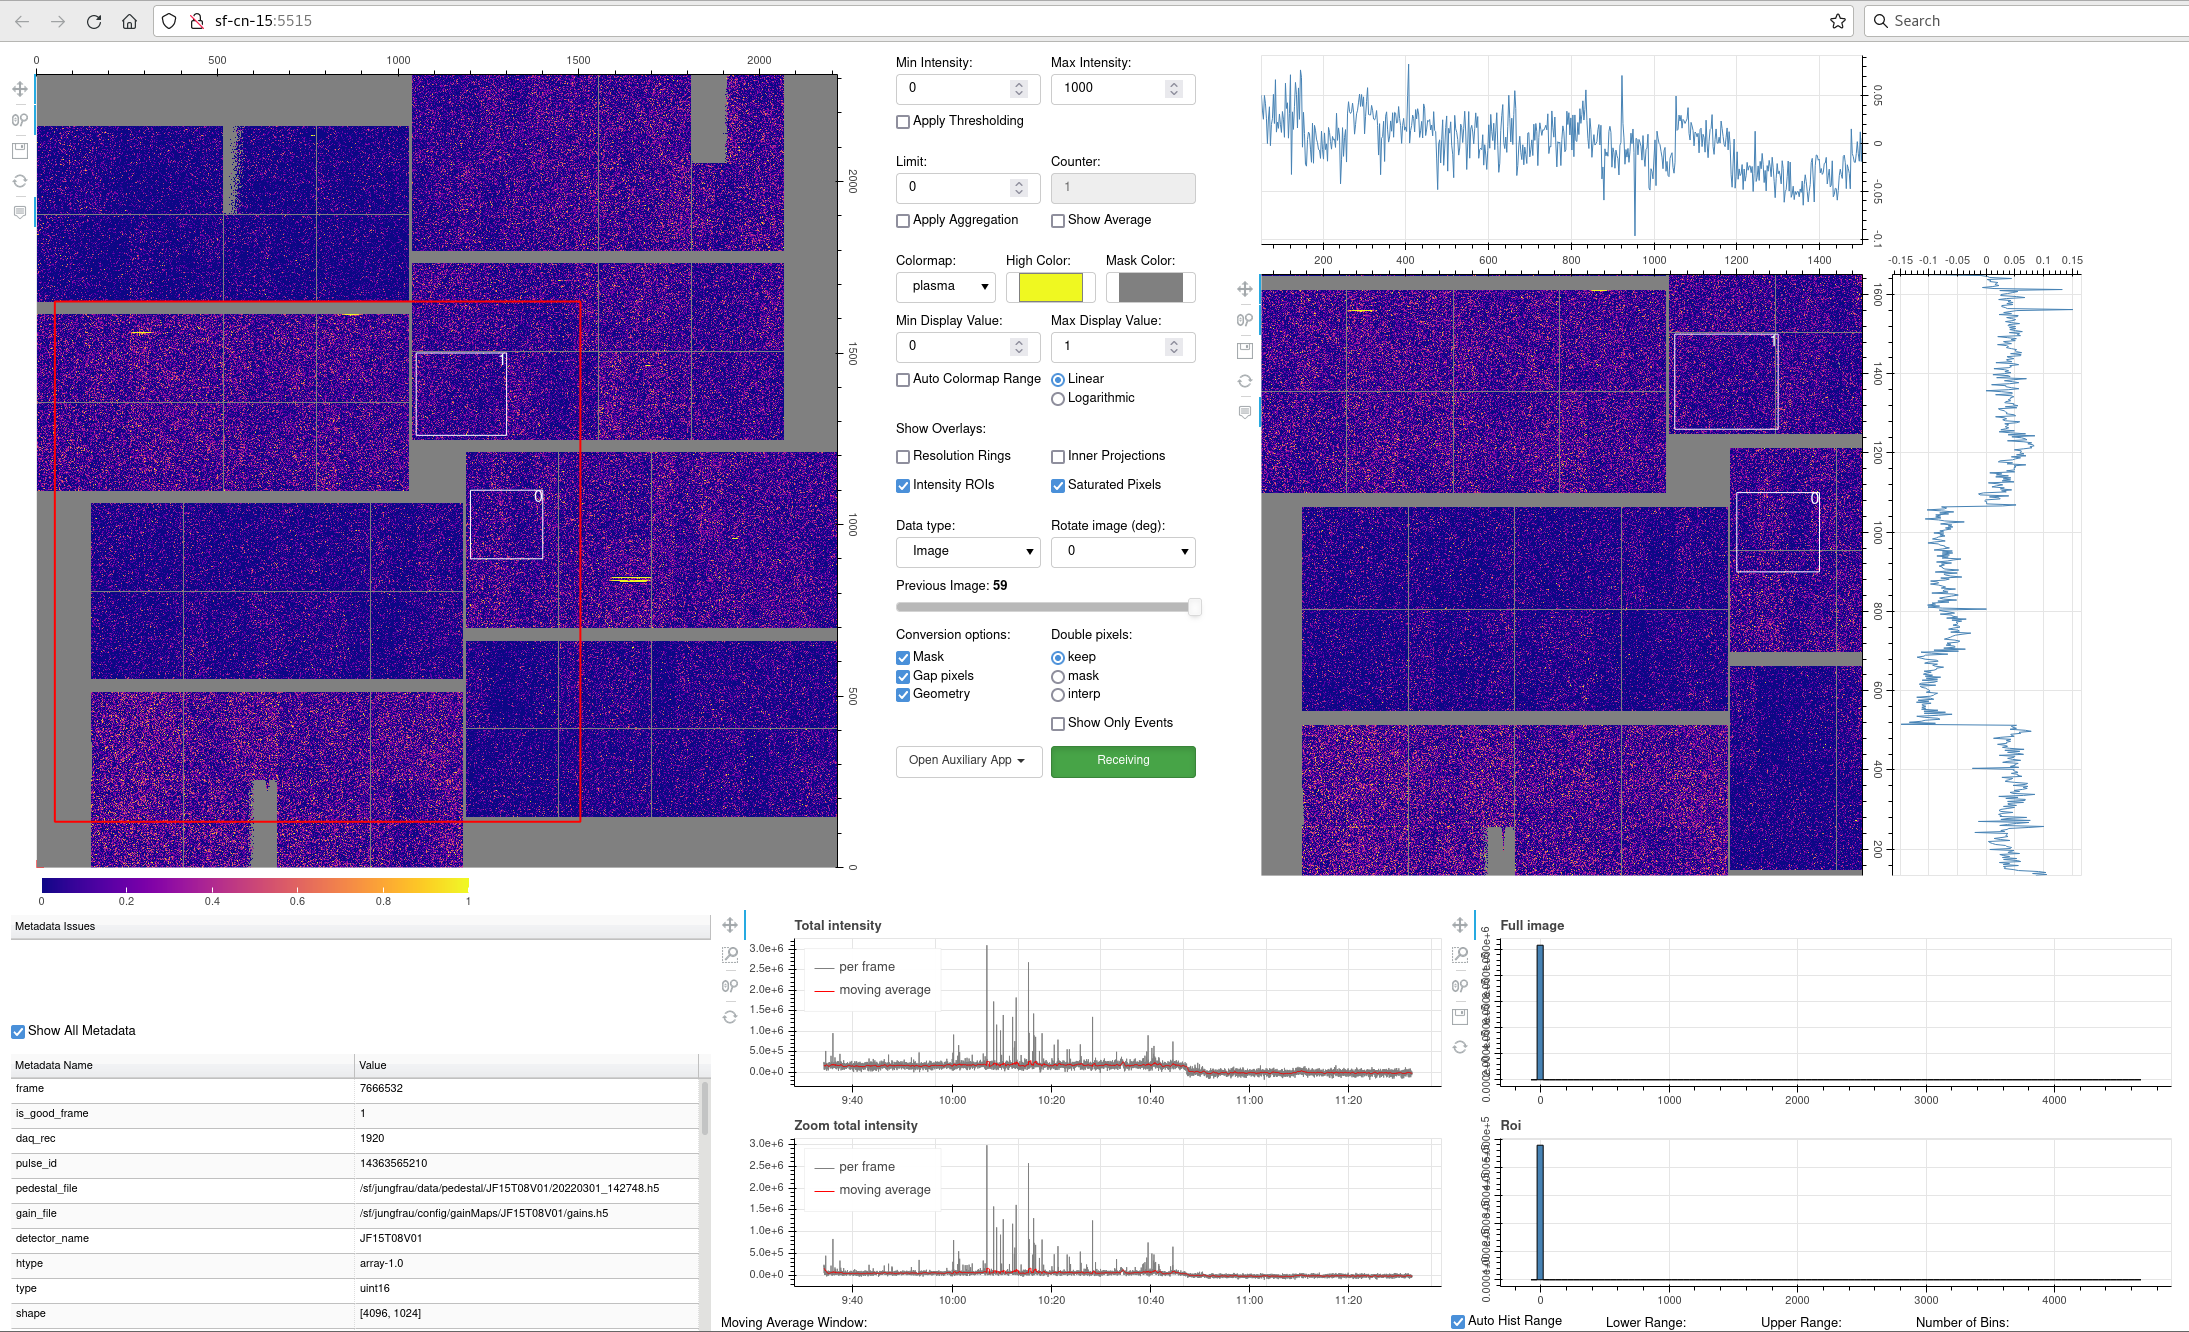
Start the browser and go to http://sf-cn-15:5515. A winodow like this should appear:
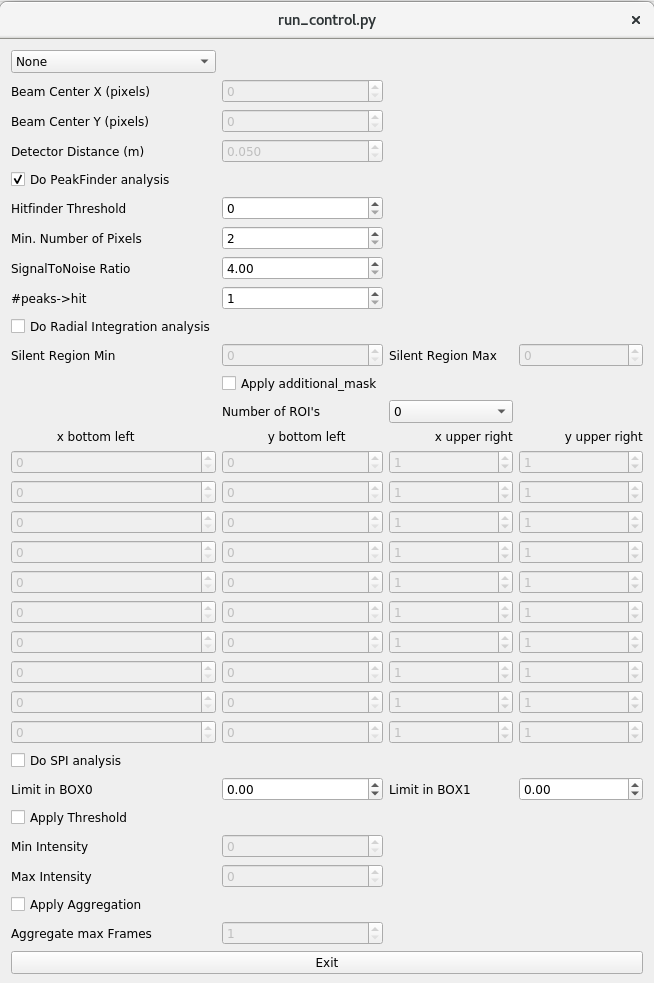
To change the visualization parameters of go to run_control - "Config" tab and click on "Data Analysis Configuration", you should see something like this:
Click on receiving to enable the live visualization.
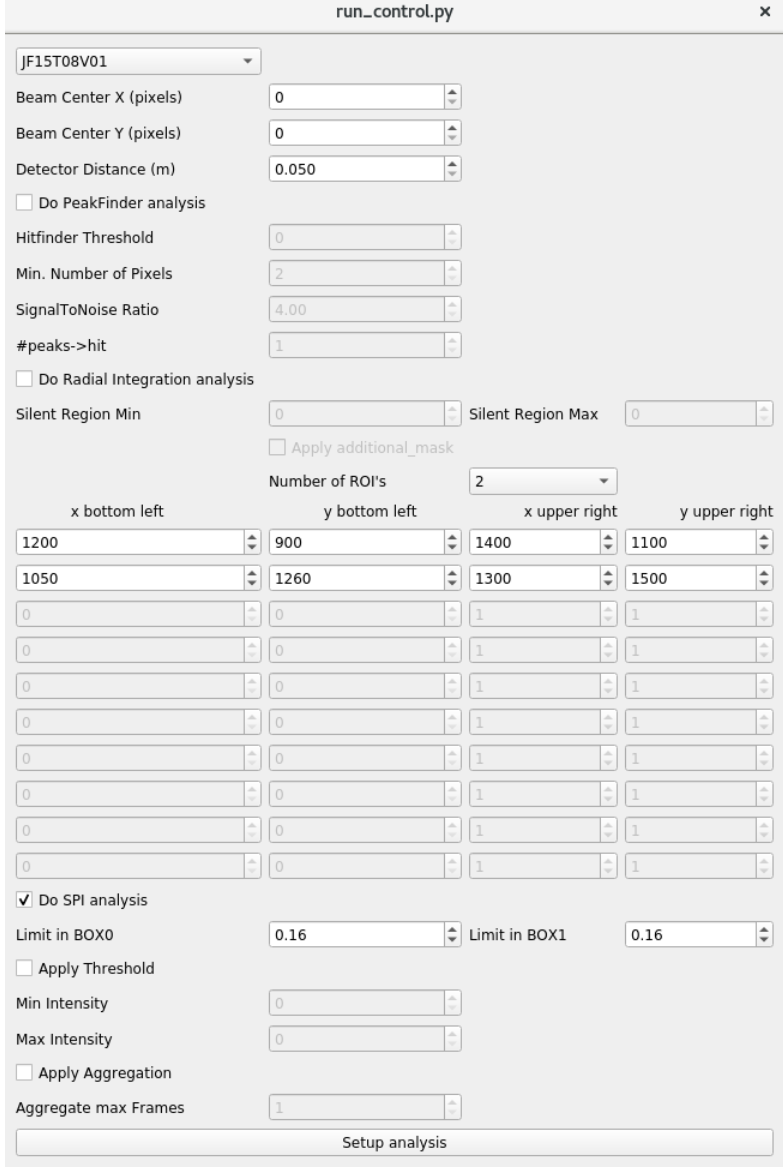
Important for SPI analysis are:
- Define at least two regions of interest (minimum number of ROI's: 2!)
- Define coordinates of the ROIs
- Check on the box "Do SPI analysis"
- Define cut-off values for the ROI0 and ROI1 ("limit in BOX0/1") - If the signal in BOX0 is larger than che cut value OR the signal in BOX1 is larger than cut value for BOX1 - that frame will be marked as "hit")
- Values/changes will only be applied after you press "setup analysis" (not when you change them in box) (this last step is to be confirmed tomorrow!)
In the live analysis panel, make sure to click on "Intensity ROIs" to visualize the ROIs in the image. To show only the "hits" (empty shots are not displayed) click on the check box "Show Only Events" on the visualization window (above the "Receiving" button).
Example of realistic values in the screen (from Pilot 3):
Notes:
- Values inside a ROI are the integrated over all pixels inside that ROI (excluding dead pixels or out of module regions) and normalized to the number of corresponding (good) pixels.
- To be able to run the SPI analysis two ROI's need to be defined (if you need only one - define second somewhere and put large cut value to it).
- It is possible to define more than two ROI's, but for SPI analysis only the first two ROI's will be taken into account.
- Defining more than two ROI's may help to define cut values, since for all the defined ROI's.
- When taking a pedestal, if we click in “Run” but we forget to click on “Take pedestal”, it saves a file called “test.runxxxx” in the "raw" data folder inside the corresponding p-group.
- The SPI display only updates the pedestal file taken into account in the metadata section after ~17 minutes but as soon as its acquisition is finished, it is already taken into account and we do not have to wait until it appears in the display.
We can open several auxiliary windows in the menu to the left of the "Receiving" button such as (normalised) ROI intensities as a function of time (also available at "http://sf-cn-15:5515/roi_intensities") or the Hit rate ("https://sf-cn-15:5515/hitrate"). To remove history, use "reset" button there.
Changing to low noise mode
On the Maloja console type:
$ . /opt/gfa/python 3.7$ pythonThe following lines will appear:
Python 3.7.7 (default, Mar 26 2020, 15:48:22)
[GCC 7.3.0] :: Anaconda, Inc. on linux
Type "help", "copyright", "credits" or "license" for more information.
Type:
>>> import requests- To see current settings of detector:
>>> r = requests.post('http://sf-daq:10003/get_detector_settings',json={'detector_name': 'JF15T08V01'}); r; r.json()The answer will be something like: {'status': 'ok', 'exptime': 1e-05, 'detector_mode': 'normal' / 'low_noise'}
- To set detector to the 'low noise' mode:
>>> r = requests.post('http://sf-daq:10003/set_detector_settings',json={'detector_name': 'JF15T08V01', "detector_mode": "low_noise"}); r; r.json()- To switch detector to normal mode:
>>> r = requests.post('http://sf-daq:10003/set_detector_settings',json={'detector_name': 'JF15T08V01', "detector_mode": "normal"}); r.json()(There will be some output)
-
If the detector is switched to other mode (from 'normal' to 'low_noise' or from 'low_noise' to 'normal') we need to take a new pedestal
-
We will see that the detector is in different mode in the live visualization (in the image and also inside "Metadata" table there will be additional information, if detector is in low_noise mode). To be checked!
